Business

How Data Helps in Account-Based Marketing
Business

How Data Helps in Account-Based Marketing (ABM)

You have a target account list. You have a CRM. You have a marketing team sending emails and a sales team making calls. And yet, three months in, nobody can say for sure if any of it is working.    That’s usually a data problem, not a strategy problem.    Data helps account-based marketing (ABM) by replacing guesswork with evidence at every stage. It tells you which accounts to go after, who inside those accounts actually makes the buying decision, when they’re ready to hear from you, and whether your campaigns moved real pipeline or just generated activity. Without it, ABM is just cold outreach with a fancier name.    This guide walks through exactly how data powers ABM, the specific data types that matter, where most programs quietly break down, and what to check before you trust the data you already have.    What Counts as “Data” in ABM? In regular marketing, data usually means individual leads: names, emails, form fills. ABM works differently. The unit of analysis is the account, not the person.    That means your data has to answer questions at the company level first.     Does this company fit our ideal customer profile?   Is anyone there researching a problem we solve?   Who are the actual decision-makers, and are we reaching more than one of them?    Six data types answer these questions together:  Firmographic data  Technographic data  Intent data  Engagement data  Buying group data  Identity and enrichment data  Each one plays a different role. Together, they turn ABM from a list of company names into a working system.    Why ABM Falls Apart Without Good Data ABM asks you to spend more time and resources on a smaller group of companies. That only works when you are confident those companies deserve the attention.    Poor data changes that quickly.    Validity’s State of CRM Data Management report found that 37% of CRM users have lost revenue directly because of poor data quality, and 76% said less than half their CRM data is accurate and complete. Numbers like that turn into missed opportunities fast once an ABM program is built on top of that same shaky data.    In an ABM program, those problems can show up as:    High-value accounts missing from the target list  Poor-fit companies receiving expensive one-to-one outreach  Emails going to people who changed jobs months ago  Multiple CRM records for the same company  Buying signals sitting under the wrong account  Sales contacting one person while missing the real decision-makers  Marketing seeing engagement that sales cannot see  Account scores based on stale or incomplete information  The campaign can still look busy. Ads get impressions. Emails get opened. Content gets downloaded.    But activity is not the same as account progress. Bad data makes it difficult to tell the difference.    The Types of Data That Power ABM Here is what each type of account-based marketing data does and the decision it helps you make.  Firmographic Data  Firmographic data covers the basic facts about a business. It includes industry, company size, annual revenue, location, business model, and growth stage.    It is usually one of the first filters used when building an ideal customer profile (ICP) and target account list.  Use it to answer a basic question: Does this company actually fit what we sell?    A 50-person retailer and a 5,000-person enterprise may have completely different budgets, buying processes, risks, and expectations. Firmographic data stops your team from treating both accounts the same.  It also helps you remove companies that were unlikely to become good customers in the first place.  Technographic Data Technographic data shows the software, platforms, and technologies a company already uses.  This information can help in several ways:    Identify accounts using a competitor  Find companies using technology your product integrates with  Spot outdated systems your service may replace  Segment accounts by their existing tech stack  Shape outreach around a specific integration or workflow  Intent Data Intent data indicates that people from an account may be researching a topic, problem, product category, or competitor related to what you sell.    It usually falls into two groups.    First-party intent data comes from activity you can see through your own channels. Examples include service-page visits, webinar registrations, content downloads, demo requests, and repeat website activity.    Third-party intent data comes from activity observed outside your owned channels. It can help identify research happening before an account directly engages with your business.    The value of intent data is timing.  A company may have matched your ICP for two years. If its research activity suddenly increases around a problem you solve, there may now be a better reason to look at the account again.    But intent is not proof of a purchase.  Someone researching a topic does not tell you whether there is an approved project, available budget, executive support, or a buying timeline. That is why intent data works better when you combine it with fit and direct engagement.  Engagement Data Engagement data tracks how a target account interacts with your company.  It may include:    Website visits  Key page views  Email responses  Content downloads  Webinar attendance  Ad engagement  LinkedIn interactions  Demo requests  Sales conversations  The useful part is not simply the total number of interactions. Look at recency, depth, and spread.    Recent activity usually matters more than activity from six months ago. A pricing-page visit may deserve more attention than a short blog visit.    Engagement across several relevant buying roles can also tell you more than activity concentrated around one contact.  Buying Group Data  Nobody signs off on a B2B deal alone anymore. Forrester’s latest research on business buying puts the typical purchase decision at 13 internal stakeholders and nine external influencers, and that number climbs even higher for larger or more complex deals.    Buying group data maps the actual roles inside an account: who controls budget, who evaluates the technical fit, who influences the decision without ever holding the pen.    Firmographic and intent data help you find the right account. Buying group data is what helps you find the right people once you’re actually inside it.  Identity and Enrichment Data  This category connects anonymous activity back to a known account. Someone visits your pricing page without filling out a form, and that visit would normally vanish into your analytics unnoticed. 

how to get leads from linkedIn
Business

How to Get Leads from LinkedIn: 10 Ways to Grow Revenue

Think about the last connection request you actually accepted. Before you clicked anything, you checked the person’s profile. Who are they? Why did they reach out? Is replying even worth ten minutes of your day?    Your prospects run the exact same check on you.  So, how do you get leads from LinkedIn? You define exactly who you’re trying to reach, build a profile that survives that ten-second scan, find those people through search or Sales Navigator, and message them with a real reason to talk. Content, Sales Navigator, direct messages, and email can all support that process. None of them will fix weak targeting or a generic pitch.     This guide walks through the whole system: finding prospects, reading buying signals, writing messages people actually answer, and tracking the results that matter instead of the ones that just look busy.     What Does It Actually Mean to Get Leads from LinkedIn?  Here is a distinction that often gets missed. A connection is not a lead. It only gives you access to someone’s network and inbox.  Someone becomes a potential lead when they match your ideal customer profile and show meaningful interest. That interest may come through a reply, a resource request, a sales question, or engagement with a problem your business solves.  Connection growth can feel like progress. But it only measures activity, not business value. Before counting someone as a lead, check four things:    Do they fit your ICP?  Is the problem relevant to them right now?  Do you have a real way to reach them?  Is there a believable next step?  If the answer is no to any of these, you’re not looking at a lead yet. You’re looking at a name.    Why LinkedIn Works Better Than Almost Any Other B2B Channel  Think about LinkedIn from the buyer’s side. Where else can you see a decision-maker’s job title, company, experience, recent activity, and professional interests in one place? That context helps you understand the person before writing the first message.    Email gives you an inbox. LinkedIn gives you context around the person behind that inbox.    LinkedIn reports that 89% of B2B marketers use the platform for lead generation. Sixty-two percent say it produces leads for them, more than twice the percentage reported for the next-highest social channel. The figures come from Wpromote’s State of B2B Marketing Report and are published by LinkedIn Marketing Solutions.    Still, having a profile does not guarantee results. Buyers receive connection requests, pitches, and promotional content every day.  They respond when the audience, offer, message, and timing work together.    The Core Problem Most Businesses Get Wrong on LinkedIn  Watch how weak LinkedIn campaigns begin.  Someone searches for a broad job title, collects hundreds of profiles, and sends the same message to all of them. The campaign fails because people with the same title do not always work for the same type of company or face the same problem.    Several other problems usually appear at the same time:    There is no clear ideal customer profile.  Every new connection is treated as a lead.  Prospects are contacted before qualification.  Messages focus on the seller instead of the buyer.  Follow-ups repeat the same request.  Replies are not tracked in a CRM.  Success is measured through connections instead of pipeline.  LinkedIn lead generation is not one tactic. It is a connected process that starts with targeting and ends with qualification, follow-up, and revenue tracking. So, how do you fix these problems? Here are 10 practical ways to get qualified leads from LinkedIn and turn more conversations into revenue.   1. Define Your Ideal Customer Before You Search Searching without an ideal customer profile wastes time on companies that were never likely to buy.    Build your ICP at two levels.  Company-level Targeting  Start with the type of company that benefits most from your offer.  Consider:    Industry  Business model  Company size  Revenue range  Region  Growth stage  Sales structure  Technology environment  Current business priorities  Ability to purchase  A target such as technology companies is too broad.    B2B SaaS companies in the United States with 20 to 200 employees and an active outbound sales team gives you something you can actually search for.  Person-level Targeting  Next, identify the people connected to the problem.  Review:    Department  Function  Seniority  Actual responsibilities  Influence over the decision  Problems connected to the role  Likely business priorities  Do not rely on job titles alone. Head of Growth, Growth Director, and VP of Growth may perform similar work at different companies.  Map the Buying Committee  Larger B2B purchases rarely depend on one person.  You may need to identify:    The economic buyer  The department leader  The daily user  The technical evaluator  The internal champion  Finance or procurement  Each stakeholder cares about a different outcome. Your message should reflect the person’s role in the decision.    2. Turn Your Profile into Something Prospects Trust Your message may create interest. Your profile decides whether that interest survives.    Before accepting a request or replying, prospects often scan your photo, headline, banner, About section, recent content, and Featured section. They want to see whether your profile supports what you just said.  Profile Photo  Use a clear and current photo with good lighting.    Your face should be easy to recognize. The image should look professional without feeling unnatural or heavily edited.  Headline  A job title tells people what position you hold. It does not always tell them why your work matters.  Write the headline around:    Who you help  What problem you solve  What outcome you support  Keep the promise accurate. Avoid guaranteed results or unsupported revenue claims.  Banner  Use the banner to reinforce your main value proposition.    Include one audience, one core offer, and one next step. Several competing messages make the banner harder to understand.  About Section  Write the About section for your buyer, not as a personal biography.    Explain the customer’s problem, why it matters, and how you approach it. Then provide a simple way to learn more or contact you.  Featured Section  Use the Featured section to show proof.  Add one or two strong assets, such as:    A relevant case study  A customer success story  A practical guide  A service page  A webinar  A lead magnet  A booking

What is Go to Market
Business

What Is Go to Market? A Complete Guide to GTM Strategy

What is go to market? Go-to-market (GTM) is the plan a business uses to bring a product to its buyers and turn that into revenue. This includes who they will sell the product to, how they will communicate their offer, how they will reach their target, and the price of their products. Businesses create GTM strategies every time they develop new products, enter the new markets, or reposition their existing products.     This guide walks you through what go-to-market means, how to build one, and how to make it actually work, if you’re planning to build your first GTM plan or fixing one that isn’t working.    What Is a Go-to-Market (GTM) Strategy? Go-to-market strategy is a cross-functional plan. It explains how a business will reach its target customers and win against competitors when launching a product or entering a market. Wikipedia describes it similarly: a plan using resources like a sales force or distributors to deliver a company’s value to customers and gain a competitive edge.    It goes well beyond a marketing plan. It pulls together product, marketing, sales, and customer success into one shared plan. If you’re the one running point on a launch, this is what separates a team rowing in the same direction from three departments quietly building three different plans and finding out on launch day.    Larry Friedman wrote the original book called Go to Market Strategy in 2002. In this book, he defines go-to-market as a strategic plan, or game plan. That definition still holds. People just tend to throw the term around loosely, and that’s usually where the confusion starts.  Why a Go-to-Market Strategy Matters Go-to-market strategy matters because it removes all your confusion from a launch. Without a strategy, you end up with:    Sales and marketing chasing different customers  Messaging that shifts depending on who’s talking  No clear way to tell if the launch is working    With a strategy, your whole team works from the same customer definition, pricing, and success metrics.    The Core Components of a Successful Go-to-Market Strategy  Go-to-market strategy is made of several moving parts. If you miss one, the rest may tend to wobble. We’ve reviewed GTM plans across SaaS, agencies, and ecommerce brands, and the weak ones are almost always missing just one piece. Once you know which one, fixing it is usually the easy part.    Here’s what each piece actually does, grouped by where it sits in the plan.  Understand who you’re selling to Market research: Real numbers on demand, market size, growth trends, and where competitors are already winning or losing.  Target market: One specific industry, company size, and geography, the segment worth chasing first.  Ideal customer profile (ICP): The firmographic profile of your best-fit account: industry, company size, budget, and the trigger event that starts their search.  Buyer personas: A breakdown of the actual people in the buying process, their job title, daily responsibilities, and what convinces them to say yes.  Customer pain points: The concrete problems costing a customer time, money, or risk right now, described in their own words.  Shape the offer and the message  Value proposition: One clear line stating the outcome a customer gets, backed by a number, result, or comparison they can verify.  Product positioning: Where you sit against direct competitors, indirect alternatives, and the option to do nothing at all.  Messaging strategy: The exact talking points, in order, that sales and marketing both use from first touch through close.  Pricing strategy: Your pricing model, flat rate, tiered, usage-based, or per-seat, along with the actual numbers behind it.  Get in front of buyers and close Distribution and sales channels: The platforms and people involved in the sale: direct sales, self-serve signup, resellers, or a mix.  Marketing strategy: The channels, content, and campaigns that build awareness and feed qualified leads into your pipeline.  Sales strategy: The process a rep follows from first contact to signed contract, covering qualification, demo, and negotiation. Keep score after the sale Customer success and retention: The onboarding, check-ins, and expansion plan that keep a customer past their first renewal.  GTM metrics and success criteria: CAC, conversion rate, and win rate, the exact numbers that tell you whether the plan is working.  Some of these deserve a closer look, since they’re the ones most GTM plans get wrong.    Ideal customer profile (ICP): The company or person most likely to buy, get value fast, and stay a customer. Not “small businesses,” but something specific: industry, size, budget, and the trigger that starts their search.    Buyer personas: Where ICP describes the company, the persona describes the person inside it: their role, daily frustrations, and what they need to see before they say yes.    Value proposition and positioning: Your value prop should name the outcome a customer actually gets. Features are rarely close to a deal on their own. Positioning is how the product is perceived against the alternatives, including the alternative of doing nothing.    How to Build a Go-to-Market Strategy Step by Step Here’s the process we walk clients through ourselves, whether that’s a five-person startup or an established company entering a new segment.    Step 1: Research the market and competitors. Look at market size, growth trends, and who’s already selling to your buyer, or your strategy targets a market that doesn’t really exist.  Step 2: Identify your ideal customers. Build your ICP from firmographic data like industry and size, plus buying signals like recent hires or funding. Vague targeting leads to vague messaging.  Step 3: Validate customer problems and demand. Talk to real prospects before building messaging around assumptions. This is the most common failure point we see, usually because someone skipped it to save time.  Step 4: Create a strong value proposition. State the outcome in words a customer would repeat back to you, backed by a number they can verify.  Step 5: Position against competitors. Decide what you want to be known for, and what you’re happy to let go of.  Step 6: Develop clear messaging. Turn that positioning into words sales and marketing both use, so every prospect hears the same story.  Step 7: Choose your pricing model. Pick flat rate, tiered, usage-based, or per-seat, whatever matches how the customer experiences value.  Step 8: Select the right channels. Pick two or three where your buyer already spends time. Covering every channel usually means doing none of them well.  Step 9: Prepare sales and customer success. Hand reps the messaging, objection handling, and demo flow before launch day. Improvising live on a launch call

crm optimization key metrics
Business

CRM Optimization Key Metrics – The KPIs That Improve CRM Performance, Sales, and ROI

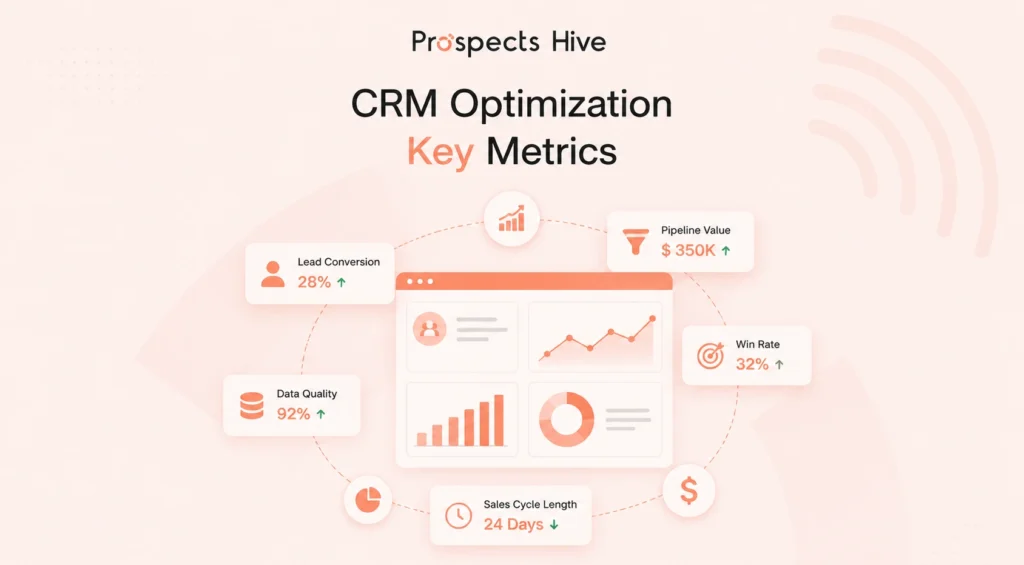
You open your CRM on Monday morning. Contacts everywhere, deals sitting in random stages, half the team logging activity and half not bothering. Nobody can tell you, with a straight face, whether any of it is working.    CRM optimization key metrics are the numbers that show whether your CRM is actually working. The core ones are lead conversion rate, customer retention rate, and CRM adoption rate, since these three reveal whether your setup is winning customers, keeping them, and getting used at all.    Skip the metrics, and your CRM is basically an expensive contact book. Track the right ones, and you’ll see exactly where your sales process breaks down, where marketing money goes to waste, and where customers start losing interest before you lose the account.    This guide walks through every CRM optimization key metric worth tracking, in plain terms, with the formulas, benchmarks, and the mistakes we keep seeing teams make.     What Is CRM Optimization Key Metrics? CRM optimization is the process of improving how your CRM performs, cleaning up bad data, automating repetitive tasks, and getting your team to use it, so it drives more revenue instead of just storing contacts.    CRM optimization key metrics are simply the numbers you use to measure that progress.  Metrics and KPIs get used interchangeably, but they aren’t the same. Metrics are numbers you can measure. KPIs are metrics tied to a real business goal.    For an example, lead conversion rates connect straight to revenue. So, it’s a KPI. Total emails sent are just a metric, a real number that doesn’t tell you much on its own.    CRM optimization key metrics zero in on the customer relationship itself: how a lead becomes a customer, and how long they stick around after that.    Good CRM KPIs shares three traits:    They connect to a real business outcome  Your CRM can track them automatically  They point to a clear next action    Why CRM Optimization Metrics Matter In real life, CRM optimization metrics turn guesswork into decisions where teams can stand behind. Here’s what they do for business.    They make performances measurable. You get an exact number to measure your performance.  They catch problems early. Sudden drops tell you exactly where to work on.  They protect retention. Warning signs show up in the data before a customer actually leaves.  They reveal wasted effort. You see which workflows save time and which just look busy.  They back decisions with proof. Every process changes now has evidence behind it.  They justify the CRM’s cost. You’ll have a real answer when leadership asks if it’s worth the money.    Essential CRM Optimization Metrics Every Business Should Track   These ten form the core of any CRM optimization strategy.    Lead Response Time  Lead response time is the amount of time it takes your team to make first contact with a new lead after it enters the CRM.    What it measures: How long it takes your team to reply to a new lead.  Why it matters: Interest fades fast. Someone who just filled out a form is thinking about you right now. Not in three hours.  Healthy benchmark: Under five minutes for website leads. One hour at the outside.  Warning signs: Response times creeping past a few hours or leads sitting untouched overnight.  How to improve it: You may automate lead assignments. That’s how a rep gets notified instantly, instead of waiting for someone to check their inbox.  Lead-to-Customer Conversion Rate  Lead-to-customer conversion rate is the percentage of leads that turn into paying customers over a given period.    What it measures: The percentage of your leads that become paying customers.  Why it matters: It’s the clearest proof your sales process actually works, starting to finish.  Healthy benchmark: Cold leads usually convert 2% to 5%. Warm leads and referrals run higher, sometimes above 20%.  Warning signs: Conversion rate staying flat even as lead volume grows. That usually means weaker leads, not more effort.  How to improve it: You must tighten qualification and put effort behind leads that match your ideal customer instead of treating every lead the same. Also, watch for the trap as most teams fall here: celebrating more leads without checking if conversion rates have moved.  Sales Pipeline Velocity Sales pipeline velocity is a measure of how fast deals move through your pipeline and turn into closed revenue, calculated from deal count, deal size, win rate, and sales cycle length.    What it measures: How fast deals move through your pipeline into closed revenue.  Why it matters: It combines deal count, deal size, win rate, and cycle length into one number.  Healthy benchmark: No universal target here. Compare your own velocity quarter to quarter.  Warning signs: Velocity slipping while the pipeline still looks full. Usually, a rep is sitting on a dead deal instead of marking it lost.  How to improve it: You can shorten the cycle, raise the win rate, or grow deal size. Do one of them.  Opportunity Win Rate Opportunity win rate is the percentage of sales opportunities that close as won deals over a given period. sales team’s batting average.     What it measures: The percentage of your opportunities that close as won.  Why it matters: It reflects how well your team sells, and how well your product actually fits the market.  Healthy benchmark: Most B2B teams land between 20% and 30%. Though this percentage shifts by industry.  Warning signs: Win rate shrinking while the pipeline keeps growing. Often a sign of weak qualification.  How to improve it: Review lost deals for patterns, coach objection handling, and tighten qualification upfront.  Average Sales Cycle Length Average sales cycle length is the average number of days it takes a deal to move from first contact to close.  What it measures: The average number of days it takes a deal to close from first contact.  Why it matters: Shorter cycles mean faster revenue and a lower cost per deal.  Healthy benchmark: SaaS deals often close in 40 to 70 days. Enterprise deals can stretch past 100.  Warning signs: Cycle length creeping up with no real change in deal complexity.  How to improve it: Cut approval steps first. In most companies we’ve audited, the slowest part of the cycle isn’t the customer deciding. It’s an approval sitting in someone’s inbox. Customer Acquisition Cost (CAC) Customer Acquisition Cost (CAC) is the total sales and marketing spend for a period divided by the number of new customers acquired in that same period.    What it measures: Total sales and marketing spend divided by new customers gained.  Why it matters: CAC only tells a real story next to CLV. On its own, it doesn’t mean much. Harvard

What is Allbound Marketing
Business

What is Allbound Marketing: A Guide for Modern B2B Growth

B2B growth is no longer a 2-lane highway, it’s a convergence zone. For years, teams ran inbound and outbound as if they were “different worlds in B2B marketing” with different playbooks, different tools, and zero shared intelligence. Thus, growth feels busy but inconsistent. But modern buyers don’t move in straight lines anymore and your revenue engine can’t either. Now that’s where Allbound enters, not as an industry buzzword but as a model that unifies inbound, outbound, and partner-led growth into one coordinated system. No silos. No data black holes.  Instead of isolated campaigns, you build a full-funnel, signal-driven growth system that actually compounds. This blog helps you get started with allbound marketing as a system that connects inbound, outbound, data, and CRM into one unified engine to ramp up your B2B growth. TL;DR Allbound marketing combines inbound + outbound + data + CRM into one system It aligns sales and marketing around shared signals, data, and execution It replaces disconnected campaigns with a coordinated GTM strategy It uses intent data, automation, and multichannel marketing to drive results The goal isn’t more activity. It’s predictable revenue growth What is Allbound Marketing and Why it Matters? Allbound marketing is a modern B2B marketing strategy that combines: Inbound marketing (content, SEO, demand generation) Outbound marketing (cold outreach, SDR motions, LinkedIn outreach) Data layers (firmographic, technographic, behavioral data) CRM and automation systems All working together inside one integrated marketing and sales system. Instead of treating inbound and outbound as separate plays, Allbound connects them through: Buyer intent signals Lead scoring Website visitor tracking Multichannel execution Shared CRM visibility At its core, Allbound is not about channels. It’s about alignment + timing + system design. The Core Idea of Allbound Marketing The core idea of Allbound marketing is to connect every touchpoint instead of relying on a single channel. The goal is not just generating leads.mThe goal is creating a system where: signals trigger outreach, content builds trust, automation keeps follow-ups moving, CRM tracks everything, and sales focuses on conversations instead of manual admin. In short: Outbound creates attention. Inbound builds trust. Automation keeps momentum. CRM keeps context. Together, they create predictable pipeline growth. The Core 5 Components of Allbound Marketing To build a real Allbound strategy, you need more than channels. You need layers that form distinct components of a complete allbound marketing strategy.  Here are the 5 core components of allbound marketing,each forming an essential layer in your strategy: 1. Signal Layer Buyer intent signals Website visitor tracking Engagement data This tells you when to act. 2. Data & Enrichment Layer Firmographic data Technographic data Behavioral data This tells you who to target and how to personalize. 3. Execution Layer Content marketing Cold outreach LinkedIn outreach Social selling This is how you engage across touchpoints. Also Read: Combining Social Selling and Outbound: A Blueprint for B2B Growth 4. CRM & Automation Layer CRM (HubSpot, Attio) Automation workflows Lead scoring This ensures nothing breaks after first touch. 5. Measurement Layer Attribution models A/B testing Pipeline tracking This shows what actually drives revenue. How Allbound Marketing Works Allbound marketing works by connecting every major part of your growth system into one coordinated flow. Instead of running outbound, inbound, content, CRM, and follow-ups separately, Allbound brings them together so every touchpoint supports the next one. Here’s how the allbound system works: 1. Start With a Unified Data Foundation Allbound starts with clean, connected data. Most teams have prospect data spread across LinkedIn, CRM, website analytics, outreach tools, and spreadsheets. The problem is that none of it talks to each other. In an Allbound system, you bring together: ICP data firmographic data technographic data behavioural signals enriched contact data CRM activity For example, you can pull target accounts from LinkedIn Sales Navigator, enrich them through Clay, add company size, tech stack, hiring trends, funding updates, and buyer signals. Now you are not targeting random lists but context-rich accounts. 2. Connect Sales and Marketing Around the Same Buyer Journey Allbound only works when sales and marketing operate from the same system. That means both teams need shared visibility into: CRM activity lead scoring website visits content engagement outreach history pipeline stage For example, if a company visits your pricing page twice, that signal should appear inside the CRM and trigger the right sales follow-up. 3. Use Content to Build Familiarity Before Outreach Outbound works better when the prospect has already seen your thinking. That is where content creates air cover. Your LinkedIn posts, case studies, short-form insights, and thought leadership help prospects understand your expertise before they ever reply. For example, a prospect receives your cold email. Before replying, they tend to check your profile. If they see clear positioning, useful insights, and relevant content, your outreach feels less cold and more contextual. 4. Layer Multiple Touchpoints Across Channels Allbound is not single-channel marketing. It combines email, LinkedIn, content, website visits, retargeting, and CRM follow-ups into one connected motion. A simple flow might look like this: A prospect receives a cold email → sees your LinkedIn content → gets a connection request → visits your website → sees a relevant retargeting ad → receives a follow-up based on their engagement. That is how Allbound creates momentum. Also Read: Cold Emailing Tools: Best Software for Scalable B2B Outbound 5. Run Account-Based Plays Based on Signals Not every lead deserves the same level of attention. Allbound helps you prioritise accounts based on fit, timing, and intent. This is where you can leverage ABM and outbound together. For example, a SaaS company raises funding, starts hiring SDRs, and visits your website. Instead of sending generic outreach, you can personalise the message around their current growth stage, hiring activity, and likely pipeline challenges. Also read: How SaaS Companies Can Scale Faster by Combining ABM and Allbound Marketing This makes outreach more signal-driven, not random. 6. Measure What Actually Moves Pipeline Allbound is not measured by vanity metrics alone. Opens, clicks, and impressions can help, but they do not tell the full story.

Scroll to Top