You open your CRM on Monday morning. Contacts everywhere, deals sitting in random stages, half the team logging activity and half not bothering. Nobody can tell you, with a straight face, whether any of it is working.
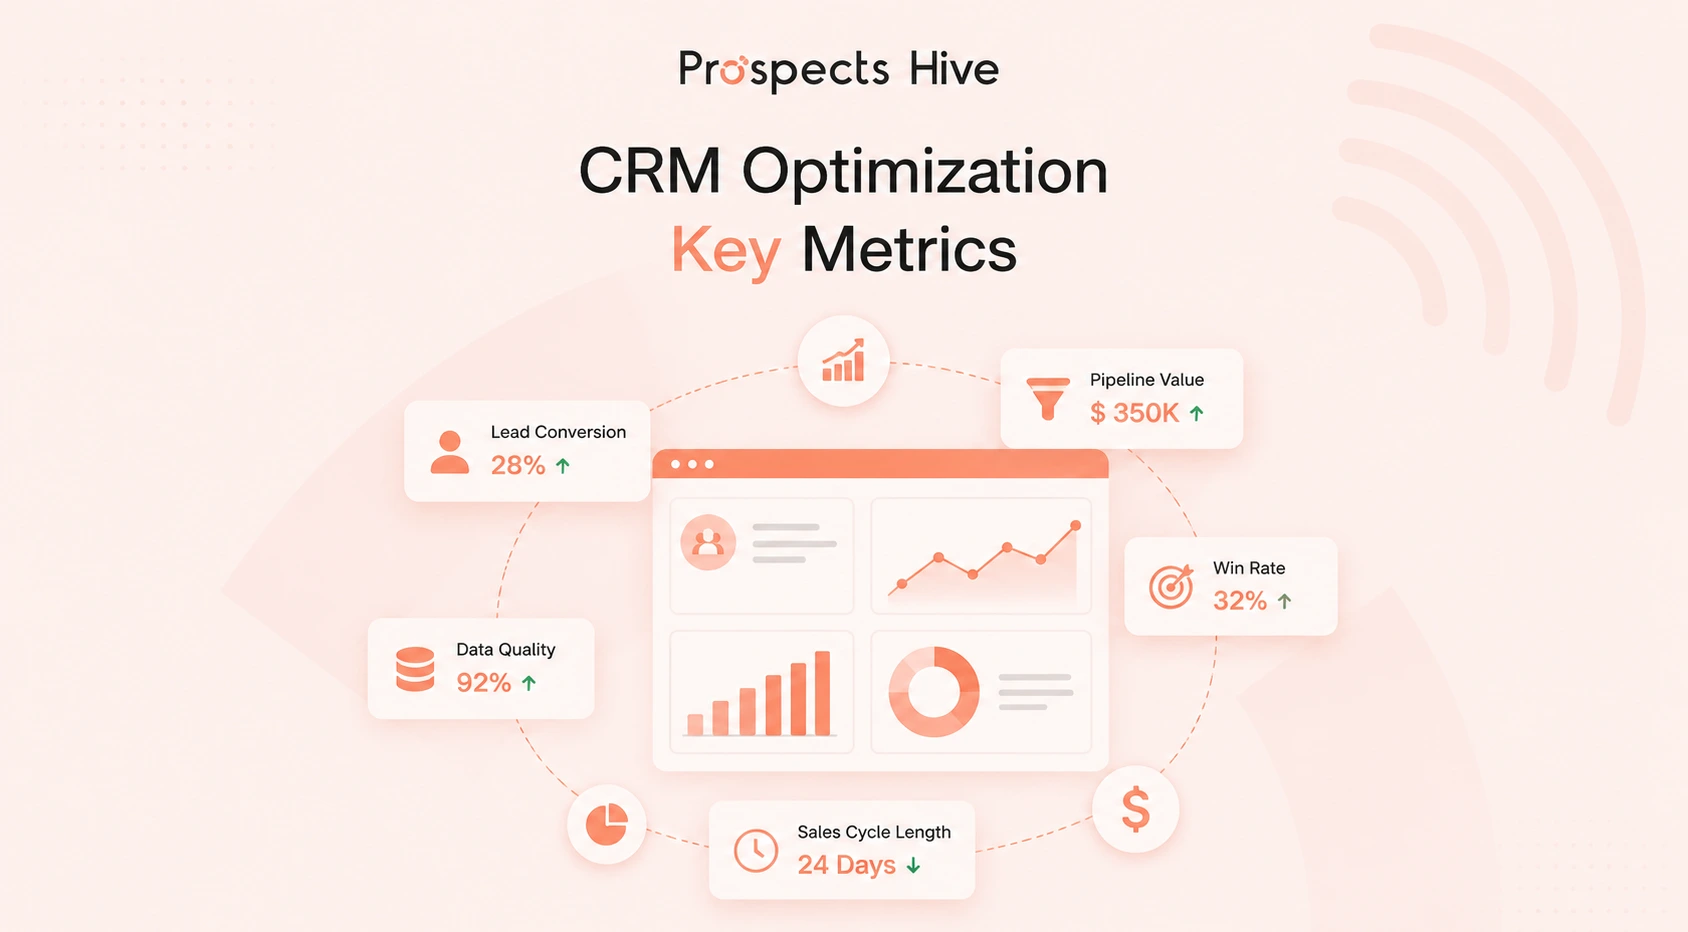
CRM optimization key metrics are the numbers that show whether your CRM is actually working. The core ones are lead conversion rate, customer retention rate, and CRM adoption rate, since these three reveal whether your setup is winning customers, keeping them, and getting used at all.
Skip the metrics, and your CRM is basically an expensive contact book. Track the right ones, and you’ll see exactly where your sales process breaks down, where marketing money goes to waste, and where customers start losing interest before you lose the account.
This guide walks through every CRM optimization key metric worth tracking, in plain terms, with the formulas, benchmarks, and the mistakes we keep seeing teams make.
What Is CRM Optimization Key Metrics?
CRM optimization is the process of improving how your CRM performs, cleaning up bad data, automating repetitive tasks, and getting your team to use it, so it drives more revenue instead of just storing contacts.
CRM optimization key metrics are simply the numbers you use to measure that progress.
Metrics and KPIs get used interchangeably, but they aren’t the same. Metrics are numbers you can measure. KPIs are metrics tied to a real business goal.
For an example, lead conversion rates connect straight to revenue. So, it’s a KPI. Total emails sent are just a metric, a real number that doesn’t tell you much on its own.
CRM optimization key metrics zero in on the customer relationship itself: how a lead becomes a customer, and how long they stick around after that.
Good CRM KPIs shares three traits:
- They connect to a real business outcome
- Your CRM can track them automatically
- They point to a clear next action
Why CRM Optimization Metrics Matter
In real life, CRM optimization metrics turn guesswork into decisions where teams can stand behind. Here’s what they do for business.
- They make performances measurable. You get an exact number to measure your performance.
- They catch problems early. Sudden drops tell you exactly where to work on.
- They protect retention. Warning signs show up in the data before a customer actually leaves.
- They reveal wasted effort. You see which workflows save time and which just look busy.
- They back decisions with proof. Every process changes now has evidence behind it.
- They justify the CRM’s cost. You’ll have a real answer when leadership asks if it’s worth the money.
Essential CRM Optimization Metrics Every Business Should Track
These ten form the core of any CRM optimization strategy.
Lead Response Time
Lead response time is the amount of time it takes your team to make first contact with a new lead after it enters the CRM.
What it measures: How long it takes your team to reply to a new lead.
Why it matters: Interest fades fast. Someone who just filled out a form is thinking about you right now. Not in three hours.
Healthy benchmark: Under five minutes for website leads. One hour at the outside.
Warning signs: Response times creeping past a few hours or leads sitting untouched overnight.
How to improve it: You may automate lead assignments. That’s how a rep gets notified instantly, instead of waiting for someone to check their inbox.
Lead-to-Customer Conversion Rate
Lead-to-customer conversion rate is the percentage of leads that turn into paying customers over a given period.
What it measures: The percentage of your leads that become paying customers.
Why it matters: It’s the clearest proof your sales process actually works, starting to finish.
Healthy benchmark: Cold leads usually convert 2% to 5%. Warm leads and referrals run higher, sometimes above 20%.
Warning signs: Conversion rate staying flat even as lead volume grows. That usually means weaker leads, not more effort.
How to improve it: You must tighten qualification and put effort behind leads that match your ideal customer instead of treating every lead the same. Also, watch for the trap as most teams fall here: celebrating more leads without checking if conversion rates have moved.
Sales Pipeline Velocity
Sales pipeline velocity is a measure of how fast deals move through your pipeline and turn into closed revenue, calculated from deal count, deal size, win rate, and sales cycle length.
What it measures: How fast deals move through your pipeline into closed revenue.
Why it matters: It combines deal count, deal size, win rate, and cycle length into one number.
Healthy benchmark: No universal target here. Compare your own velocity quarter to quarter.
Warning signs: Velocity slipping while the pipeline still looks full. Usually, a rep is sitting on a dead deal instead of marking it lost.
How to improve it: You can shorten the cycle, raise the win rate, or grow deal size. Do one of them.
Opportunity Win Rate
Opportunity win rate is the percentage of sales opportunities that close as won deals over a given period. sales team’s batting average.
What it measures: The percentage of your opportunities that close as won.
Why it matters: It reflects how well your team sells, and how well your product actually fits the market.
Healthy benchmark: Most B2B teams land between 20% and 30%. Though this percentage shifts by industry.
Warning signs: Win rate shrinking while the pipeline keeps growing. Often a sign of weak qualification.
How to improve it: Review lost deals for patterns, coach objection handling, and tighten qualification upfront.
Average Sales Cycle Length
Average sales cycle length is the average number of days it takes a deal to move from first contact to close.
What it measures: The average number of days it takes a deal to close from first contact.
Why it matters: Shorter cycles mean faster revenue and a lower cost per deal.
Healthy benchmark: SaaS deals often close in 40 to 70 days. Enterprise deals can stretch past 100.
Warning signs: Cycle length creeping up with no real change in deal complexity.
How to improve it: Cut approval steps first. In most companies we’ve audited, the slowest part of the cycle isn’t the customer deciding. It’s an approval sitting in someone’s inbox.
Customer Acquisition Cost (CAC)
Customer Acquisition Cost (CAC) is the total sales and marketing spend for a period divided by the number of new customers acquired in that same period.
What it measures: Total sales and marketing spend divided by new customers gained.
Why it matters: CAC only tells a real story next to CLV. On its own, it doesn’t mean much. Harvard Business School research puts the cost of acquiring a new customer at five to twenty-five times more than keeping an existing one, which is exactly why this number can’t be read alone.
Healthy benchmark: Roughly a third of customer lifetime value or lower.
Warning signs: CAC climbing while revenue per customer stays flat.
How to improve it: Cut spend on channels that aren’t converting and improve conversion. In this way, the same budget produces more customers.
Quick example: Spend $10,000 and land 50 customers, and your CAC is $200.
Customer Lifetime Value (CLV)
Customer Lifetime Value (CLV) is the total revenue a business can expect from one customer across the entire span of their relationship.
What it measures: Total revenue expected from one customer across the full relationship.
Why it matters: It tells you how much you can afford to spend winning and keeping a customer.
Healthy benchmark: CLV to CAC ratio of 3:1 or better.
Warning signs: That ratio drifting toward 1:1. You’re barely breaking even.
How to improve it: Encourage upsells and repeat purchases and invest in retention.
Quick example: Take a customer paying $50 a month for two years. Their CLV comes to $1,200.
Customer Retention Rate
Customer retention rate is the percentage of customers a business keeps over a given period of time. Keeping a customer is almost always cheaper than winning a new one.
What it measures: The percentage of customers you keep over a set period.
Why it matters: It’s a direct sign that the customer still sees value in what you offer. Research on CRM systems and SME performance found retention gains of 25% to 40% among businesses that acted on this number instead of only tracking it.
Healthy benchmark: Usually 70% to 85%, depending on your industry.
Warning signs: Slow decline across several quarters. Easy to miss if you only check occasionally.
How to improve it: Reach out well before renewal, not at the last minute. Most retention conversations start too late, right when the renewal email lands.
Customer Churn Rate
Opportunity win rate is the percentage of sales opportunities that close as won deals within a chosen time window. Churn is retention’s mirror image, and it deserves the same attention.
What it measures: The percentage of customers who stop doing business with you.
Why it matters: Even small churn compounds over time, eating into revenue new sales can’t replace.
Healthy benchmark: Healthy SaaS businesses keep monthly churn under 5%.
Warning signs: Churn clustering around one plan, segment, or onboarding group.
How to improve it: Group churned customers and look for a shared cause. Price, support, or fit usually explains most of it.
Quick example: Start with 500 customers, lose 25, and your churn rate is 5%.
Revenue Growth Rate
Revenue growth rate is the percentage increase in a company’s revenue when comparing one period to the one before it, such as month over month or year over year. Every other metric on this list eventually feeds into this one.
What it measures: How much revenue grows over time, usually tracked monthly or yearly.
Why it matters: It’s the scoreboard showing whether your other improvements add up to anything.
Healthy benchmark: Early-stage companies often target 15% to 20% monthly growth. Mature companies aim for steady annual growth instead.
Warning signs: Growth relying entirely on new customers while retention quietly slides.
How to improve it: Balance new customer growth with expansion revenue from existing accounts.
CRM Metrics Formula Table
Here’s the table to bookmark whenever you need to run one of these calculations yourself.
| Metric | Formula | What It Measures |
| Lead Conversion Rate | (Converted Leads ÷ Total Leads) × 100 | Percentage of leads that become customers |
| Win Rate | (Deals Won ÷ Total Opportunities) × 100 | Sales team’s closing effectiveness |
| Pipeline Velocity | (Opportunities × Avg. Deal Value × Win Rate) ÷ Sales Cycle Length | Speed of revenue moving through the pipeline |
| Customer Retention Rate | ((Customers at End − New Customers) ÷ Customers at Start) × 100 | Percentage of customers kept over time |
| Customer Churn Rate | (Customers Lost ÷ Customers at Start) × 100 | Percentage of customers lost over time |
| Customer Lifetime Value | Avg. Purchase Value × Purchase Frequency × Customer Lifespan | Total revenue expected from one customer |
| Customer Acquisition Cost | Total Sales and Marketing Spend ÷ New Customers Acquired | Cost to acquire one new customer |
| Sales Cycle Length | Total Days to Close All Deals ÷ Number of Deals | Average time to close a deal |
| Marketing ROI | (Revenue from Marketing − Marketing Spend) ÷ Marketing Spend × 100 | Return generated per marketing dollar spent |
Sales Performance Metrics
These are the metrics we’d have you tracking if you run a sales team day to day.
- Qualified Lead Conversion Rate tracks how many of your qualified leads become paying customers.
- Pipeline Coverage compares your pipeline value to your revenue target, usually three to four times coverage.
- Sales Forecast Accuracy compares what your team predicted to what actually closed. Low accuracy usually means messy CRM data.
- Average Deal Size tracks your typical revenue per closed deal. Shrinking average deal size often means your reps are chasing easier accounts.
- Sales Efficiency is a measure of your revenue versus its cost to generate that revenue.
- Revenue per Sales Rep indicates how much revenue your sales rep makes for you, thus easily helping you identify your top employees.
Marketing Performance Metrics
Marketing metrics show whether your campaigns feed good leads into the CRM or just add noise.
- Marketing KPIs indicate if your campaigns bring good leads into the CRM system or if all they do is produce noise.
- MQL to SQL Conversion Rate shows how many of your MQLs turn into SQLs.
- Cost Per Lead (CPL) determines the cost of generating one lead. A comparison between channels will help determine where your money goes further.
- Campaign Conversion Rate reveals the percentage of your visitors who took the desired action.
- Email Open Rate shows how many recipients open your emails, which is on average between 15% to 25%.
- Click-Through Rate (CTR) measures how many of your email recipients clicked on the links in your email or advertisement. That is on average between 2% to 5%.
- Marketing ROI measures your marketing revenues against your expenses.
Customer Success Metrics
These metrics show how your customers feel once the sale is done, and the real relationship begins.
- Net Promoter Score (NPS) asks customers how likely they are to recommend to you, on a scale of 0 to 10. Above 50 counts as excellent.
- Customer Satisfaction Score (CSAT) measures how satisfied customers are right after one interaction. 80% or higher is generally considered strong.
- Customer Effort Score (CES) measures how easy it was for your customers to get something done.
- Repeat Purchase Rate tracks how many of your customers buy more than once. Key for ecommerce and subscriptions.
- Expansion Revenue measures extra revenue from upsells and upgrades, often the cheapest revenue you can generate.
- Net Revenue Retention (NRR) tracks revenue from existing customers, including expansions minus losses. Above 100% means your existing customers alone are growing your revenue.
CRM Data Quality Metrics
Bad data quietly wrecks every other metric in this guide. Validity’s research on CRM data health found that 44% of companies lose at least 10% of annual revenue because of it. That’s not a rounding error. That’s real money walking out the door because the phone number was wrong.
- Data Accuracy measures how correct your CRM records are compared to real life.
- Duplicate Record Rate tracks records that exist more than once. Confuses your reps and skews your reports.
- Contact Record Completeness measures how many required fields are actually filled in.
- Missing Data Percentage shows the share of records missing key details.
- Invalid Email Rate tracks how many emails are wrong, outdated, or bounced.
- Record Freshness measures how recently a record was updated.
- Data Decay Rate tracks how fast data goes stale, often 25% to 30% a year for B2B contacts.
- Record Merge Rate tracks how often duplicates get merged. Rising merge rate is actually good news. It means your cleanup is working.
CRM Adoption Metrics
None of these matters if your team quietly avoids the CRM itself. We’ve seen six-figure CRM contracts get used as little more than a contact list.
- Active CRM Users track how many of your licensed users actually log in and work inside the system.
- Login Frequency measures how often each person opens the CRM.
- Activity Logging Rate shows what percentage of calls and emails get logged instead of happening off the record.
- Workflow Usage tracks how often your team uses the workflows you’ve built.
- Automation Adoption measures what share of your available automations are actually running.
- Mobile CRM Usage tracks how often your team opens the CRM app on their phone.
- Feature Adoption Rate measures what share of your CRM’s features get used. Most companies use less than half of what they pay for.
AI and Automation Metrics for Modern CRMs
CRMs increasingly lean on AI to score leads, draft emails, and forecast revenue. These metrics show if that AI is actually helping or just adding another dashboard, nobody checks.
- AI Lead Scoring Accuracy compares AI-predicted scores against real outcomes.
- Automation Completion Rate tracks how many workflows finish without a person stepping in.
- AI Email Engagement compares open and reply rates on AI-drafted emails against ones written by hand.
- AI Opportunity Recommendations tracks how often reps actually act on AI-suggested next steps.
- Workflow Automation Time Savings estimates hours saved each week by automating manual tasks.
- Manual Task Reduction measures the drop in repetitive work once automation takes over.
- AI Sales Forecast Accuracy compares AI forecasts against actual results, and against a manager’s own forecast.
CRM Benchmarks: What Good Performance Looks Like
Treat these ranges as a starting point.
| Metric | Typical Healthy Range |
| Lead response time | Under 5 minutes to 1 hour |
| Lead conversion rate | 2% to 5% |
| Opportunity win rate | 20% to 30% |
| Customer retention rate | 70% to 85% |
| Customer churn rate | Under 5% monthly for SaaS |
| Net Promoter Score | Above 30 is good, above 50 is excellent |
| CRM adoption rate | Above 70% of licensed users active weekly |
| Data completeness | Above 80% of required fields filled |
| Pipeline velocity | Compare against your own past quarters |
Benchmarks shift by industry, company size, and sales model. So, compare your CRM optimization key metrics against your own past numbers first, and industry averages second.
CRM Dashboard Metrics to Monitor
Every metric does not need your daily attention. You may check the right number at the right time.
Daily Metrics
Lead response time, new leads, and activity logging rate. Reps and managers own these.
Weekly Metrics
Pipeline value, win rate, and email engagement. Sales and marketing leaders track trends here.
Monthly Metrics
Conversion rate, churn rate, CAC, and marketing ROI move slower. In this case, a monthly check is enough.
Quarterly Metrics
CLV, net revenue retention, and data quality scores. Executives use these for strategy.
Which CRM Optimization Metrics Should You Track?
Nobody needs all fifty metrics here. Start with whichever set matches your business.
Startups
Speed matters most: Lead Response Time, Lead Conversion Rate, Customer Acquisition Cost.
SaaS Companies
Recurring revenue matters most: Monthly Recurring Revenue, Net Revenue Retention, Churn Rate, Customer Lifetime Value.
B2B Businesses
Pipeline health matters most: Pipeline Velocity, Win Rate, SQL Conversion Rate, Sales Cycle Length.
Ecommerce Businesses
Repeat behavior matters most: Repeat Purchase Rate, Average Order Value, Customer Lifetime Value.
Common CRM Metric Mistakes to Avoid
We’ve watched even careful teams fall into these traps.
- Tracking too many KPIs. Pick a handful tied to your goal and let the rest wait.
- Measuring vanity metrics. Login counts feel good but rarely connect to revenue.
- Ignoring data quality. Bad data gives you a confident, wrong answer.
- Low CRM adoption. Spotty logging means every report is missing pieces too.
- Skipping benchmarks. Numbers without context don’t tell you much.
- Skipping regular audits. Metrics drift as the business changes, so check quarterly.
- Ignoring customer success metrics. Acquisition gets attention while retention gets ignored.
How to Improve CRM Performance Using Metrics
This is the framework we rely on to turn CRM optimization key metrics into real improvement.
Step 1: Audit Your Data
Check for duplicates, missing fields, and outdated records.
Step 2: Measure Your Baseline
Record where each metric stands today.
Step 3: Find the Bottleneck
Look for the stage where deals stall or customers disengage.
Step 4: Fix the Workflow
Shorten approval steps and smooth handoffs between sales and marketing.
Step 5: Automate the Busywork
Hand off data entry, reminders, and follow-ups wherever you can.
Step 6: Track the Improvement
Watch your key metrics weekly after each change.
Step 7: Review Monthly
CRM optimization never really finishes. Revisit your metrics every month.
How Prospects Hive Helps Businesses Optimize CRM Performance
Everything in this guide depends on clean data and consistent execution, and both are hard to sustain in-house without someone dedicated to watching them.
This is the exact problem we hear on nearly every discovery call: a team wants better CRM numbers, but their data is a mess, and nobody’s tracked adoption in months. Here’s how our process lines up with the framework above:
- CRM audits and strategy. We review your setup, your data, and the gaps in your workflow.
- Data cleanup and enrichment. We remove duplicates and fill in what’s missing.
- Lead management optimization. We sharpen routing, scoring, and follow-up.
- Workflow automation. We take repetitive work off your team’s plate.
- Sales and marketing alignment. We get both teams working from the same data.
- Dashboard and reporting setup. We put the right numbers in front of the right people.
- Tool integration. We connect your CRM to the rest of your tech stack.
- Ongoing monitoring. We keep improvements on track after the first fix.
Short on the bandwidth to build and run this internally? That’s the gap we exist to close.
The Bottom Line
So, what actually optimizes a CRM? Strip away the dashboards and the acronyms, and it comes down to tracking the right CRM optimization key metrics and actually acting on them. Fix what the warning signs point to. Review the numbers on a set schedule. Do that consistently, and the CRM stops being a filing cabinet and starts being the tool it was supposed to be.
None of this is complicated in theory. The hard part is doing it consistently, without letting the dashboard collect dust after the first quarter.
Start with five CRM optimization key metrics: conversion rate, retention rate, churn rate, CAC, and CLV. Add the rest once those feel steady. That’s really the whole approach.
Frequently Asked Questions
What’s the difference between a CRM metric and a CRM KPI?
CRM KPIs are metrics tied directly to a business outcome, like lead conversion rate connecting straight to revenue. CRM metrics are just numbers you can measure, like total emails sent, without necessarily proving anything. Every KPI is a metric. Not every metric is a KPI. Numbers that don’t move revenue, retention, or efficiency aren’t KPIs, no matter how often you report them.
How often should you review CRM metrics?
Daily: lead response time and activity logging rate. Monthly: conversion rate, churn rate, and CAC. Quarterly: CLV and net revenue retention. Faster-moving numbers need faster check-ins. Slower-moving numbers just need consistency.
Do you need special software to track these metrics?
No. HubSpot, Zoho, and Pipedrive already calculate conversion rate, win rate, and pipeline value automatically inside their built-in reports. CAC, CLV, and data quality scores usually need a simple formula or a light integration on top. Clean data and consistent activity logging matter more than which software you use.
What’s the one metric to start with if you can only track one?
Lead-to-customer conversion rate. It sits closest to revenue, and every other metric on this list exists mainly to explain why that one number moves. Track this alone for 90 days and you’ll already know where your sales process is bleeding leads.
How long does CRM optimization take to show results?
Quick wins, like automating lead assignments or cleaning duplicate records, show up in 2 to 4 weeks. Retention and CAC take longer, usually one to two full sales cycles, since you need enough closed deals to see a real trend instead of noise.
Do small businesses really need to track all these metrics?
No. Pick three to five metrics tied to your biggest current problem, whether that’s slow lead response, high churn, or a leaky pipeline, and ignore the rest until those are under control. Tracking all fifty at once usually means none of them get acted on.